
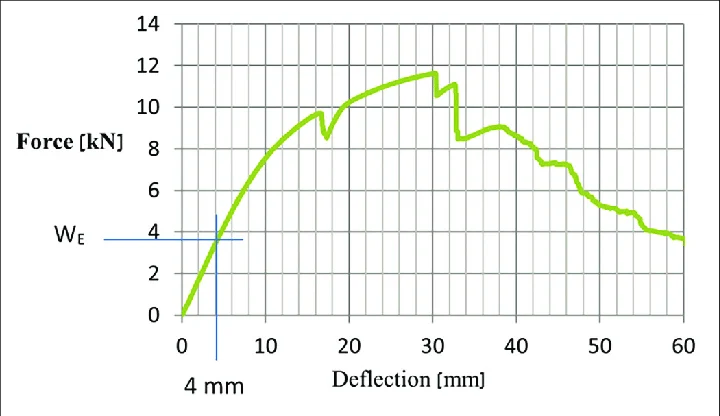
A force-deflection curve is your spring’s life story in two dimensions. The X-axis is deflection—how far the spring compresses or extends. The Y-axis is force—how hard it’s pushing or pulling back. Plot a few data points and connect them, and you have a curve that tells you everything about how that spring actually behaves.
Yet most engineers treat force-deflection curves like artifacts. They print them out, file them away, or glance at them long enough to confirm the spring “looks right” before moving on. This is a missed opportunity. A force-deflection curve reveals whether your spring will perform reliably, where it might fail, and whether it’s appropriate for your application.
Learning to read these curves properly transforms your ability to specify, troubleshoot, and validate springs.
What a Force-Deflection Curve Actually Shows
Start with the basics. You load a spring incrementally—apply a small force, measure the deflection, record both numbers. Apply a slightly larger force, measure again. Repeat this process across the operating range of the spring. Plot all these points, and you get a curve.
For an ideal spring following Hooke’s Law, this curve is a perfectly straight line. The slope of that line is the spring constant—a measure of stiffness. A steep slope means a stiff spring; a shallow slope means a soft spring. A spring with a spring constant of 100 N/mm requires 100 Newtons of force to compress it one millimeter.
But real springs don’t always follow the ideal. The curve might be perfectly linear over its operating range, or it might deviate. How it deviates tells you critical information about the spring’s condition, the material quality, and whether it’s suitable for the application.
Linear vs. Non-Linear Behavior
A perfectly linear force-deflection curve is what you want in most applications. Load the spring incrementally, and the force increases proportionally. You can predict exactly how much force you’ll get at any deflection point within the operating range.
Non-linear behavior is the deviation. The curve bends. In the early stages of loading, the spring might be softer (the slope is shallow), but as deflection increases, the slope steepens—the spring gets stiffer. Or the reverse: the spring starts stiff and becomes softer as you load it further.
Why would this happen? Several reasons. First, the initial tension in extension springs creates non-linearity in the early part of the curve. Remember from the previous article—extension springs start with built-in tension. The first part of the curve reflects overcoming that initial tension, and the slope changes once you’re fully engaged.
Second, if the spring is coiled on a tapered mandrel or if the coil diameter changes slightly along the length of the spring, the spring rate might vary with deflection. Third, if the spring is already partially yielded or if you’re loading into the plastic region, the curve stops following Hooke’s Law.
For most industrial applications, you want linear behavior. You want to know that the spring constant is consistent, so you can predict performance across the full operating range.
Reading the Slope: What Spring Constant Tells You
The slope of the force-deflection curve is the spring constant. A steeper slope = stiffer spring. A shallower slope = softer spring.
Engineers specify spring constants for a reason: they need to know how much deflection they’ll get at a given load. In an automotive suspension, the spring constant determines how much the chassis compresses at a given vehicle weight. Too stiff, and the ride is harsh. Too soft, and the chassis sags unacceptably.
When you test a spring and get the force-deflection curve, the first thing you should check is whether the spring constant matches the specification. A spring that was supposed to be 50 N/mm but tests at 48 N/mm is close enough (typically within 5% is acceptable). A spring that tests at 45 N/mm might indicate material variation or a manufacturing problem.
The other question: is the slope consistent? Does the curve maintain the same slope across the entire operating range, or does it flatten out or steepen? Flatness as deflection increases might indicate the coils are bottoming out—they’re compressing so far that adjacent coils are touching, and the spring can’t compress further without massive force. Steepness might indicate you’re approaching the plastic region where the material is starting to yield.
Neither is desirable. A good spring has a consistent slope throughout its operating range.
Identifying the Operating Range
The force-deflection curve is typically plotted from zero deflection to maximum deflection. But the “operating range” is a narrower band—the range over which the spring actually works in your application.
If you’re testing a suspension spring that’s supposed to handle vehicle weight loads from 5 kN to 20 kN, the operating range on the curve is the portion of the line corresponding to those forces. Within the operating range, the spring should be linear and consistent.
Outside the operating range—beyond the maximum load—you enter the region where coils might bottom out, where plastic deformation might start, or where the spring behaves unpredictably. Avoid that region. If you’re specifying a spring, make sure the operating range is well within the limits where the curve is linear and predictable.
Hysteresis: The Gap Between Loading and Unloading
Here’s a practical detail that surprises many engineers: the force-deflection curve when you’re loading a spring (applying force, increasing deflection) is not identical to the curve when you’re unloading (removing force, decreasing deflection). The unloading curve sits slightly below the loading curve, creating a gap or loop. This gap is called hysteresis.
Hysteresis represents energy lost as the spring deforms and recovers. Some of this energy goes into internal friction in the material. Some goes into friction between the coils. A small hysteresis loop is normal and acceptable. A large loop indicates energy loss and might suggest material quality issues or contamination.
In cyclic loading applications—springs that are repeatedly compressed and extended—hysteresis matters. With each cycle, a small amount of energy is lost to hysteresis. Over millions of cycles, this adds up. A spring with high hysteresis will experience more relaxation and might fail sooner than a spring with low hysteresis.
When you test a spring, the hysteresis loop is visible on the force-deflection curve. A tight, narrow loop is good. A wide, fat loop is a red flag.
What Deviation From Linearity Means
Beyond the hysteresis loop, other deviations from perfect linearity are warning signs.
If the curve shows a kink—a sudden change in slope at a particular deflection—you’ve likely found a design problem or a manufacturing flaw. A kink at low deflection might indicate initial tension (normal for extension springs). A kink at high deflection might indicate coil bottoming or material yielding. Either way, the curve is telling you that the spring doesn’t behave predictably across its range.
If the curve shows a flat region—a section where deflection increases but force stays roughly constant—you’re likely in the plastic deformation region where the material is yielding. This is a problem. Once you enter plastic deformation, the spring won’t fully recover when you remove the load. Permanent set increases.
If the curve shows a bend or curve instead of a straight line, the spring constant is changing with deflection. This might be acceptable if you know it’s coming (tapered springs, for example, have intentionally non-linear characteristics). But if you’re expecting linearity and you see a curve, you need to investigate why.
Comparing Curves: Specification Validation
When you receive a batch of springs from a supplier, you should receive test data—ideally including force-deflection curves. The first check: does this curve match the specification?
Plot the supplier’s curve against the specification curve. They should overlay closely. The supplier’s spring constant should fall within the tolerance band (usually ±5-10%, depending on the application). The supplier’s curve should be linear through the operating range.
If the supplier’s curve is systematically higher (stiffer) or lower (softer) than spec, you have a material or manufacturing issue. If the curve is non-linear where it should be linear, investigate. If the hysteresis loop is unusually large, ask the supplier why.
Comparing curves from different batches also reveals manufacturing drift. If batch #1 from January tests at 50 N/mm and batch #2 from March tests at 48 N/mm, you might be seeing a gradual material change or a process drift that needs attention before it becomes a real problem.
Force-Deflection Curves in Fatigue Testing
In fatigue testing—where you cycle a spring millions of times—the force-deflection curve is measured periodically to track how the spring changes.
You might measure the curve at the start (baseline), after 100,000 cycles, after 500,000 cycles, and after one million cycles. If the spring is holding up well, all four curves should be nearly identical. If the spring is degrading, you’ll see the curves shift. The slope might decrease (the spring becomes softer), the hysteresis loop might widen (more energy loss), or the curve might show non-linearity developing where there was none before.
A series of force-deflection curves from a fatigue test tells a story. A flat story (all curves identical) means the spring is reliable. A degrading story (curves shifting downward with each measurement) means the spring is losing capacity—a red flag. A sudden shift (curves are identical, then one measurement shows a dramatic change) might indicate a crack or sudden failure is imminent.
Standards and Curve Interpretation
Testing standards like ASTM E468 (axial fatigue) and DIN 2089 (compression spring cycling) define how to generate force-deflection curves, what loading rates to use, and how to report the data. These standards exist because consistent measurement methods allow comparison.
However, standards don’t interpret the curve for you. They tell you how to measure; you have to understand what the measurement means. A force-deflection curve that meets the standard might still show concerning behavior if you know how to read it.
Putting It Together: A Practical Example
Imagine you’re validating a compression spring for an automotive valve assembly. The specification calls for a spring constant of 100 N/mm, linear across the operating range of 5-25 mm deflection.
You test a sample from the production batch. The force-deflection curve shows:
A linear relationship from 0-30 mm deflection with a slope of 100 N/mm. At 25 mm deflection (the max operating point), the force is 2,500 N, which matches the specification exactly. The hysteresis loop is tight and barely visible. The curve shows no kinks, bends, or deviations.
Result: this spring passes. The curve tells you it will perform predictably within the operating range and won’t relax or degrade unexpectedly.
Now imagine a different sample from a different supplier. The force-deflection curve shows:
Linear behavior from 0-15 mm, but then the curve flattens—the slope decreases from 100 N/mm to 85 N/mm in the 15-25 mm range. The hysteresis loop is large and visible. At 25 mm deflection, the force is only 2,375 N, which is 5% below spec.
Result: this spring fails. The flattening slope indicates coil bottoming or material issues. The large hysteresis loop suggests energy loss. The below-spec force is the confirmation. This spring would not perform reliably in the field.
The force-deflection curve caught these problems that a single-point static load test might have missed.
Moving Forward With Data
Every spring test produces a force-deflection curve. Most engineers never look at it carefully. Start looking. Learn to read the slope, identify the operating range, spot deviations, and compare curves over time or across batches.
A force-deflection curve is your spring’s report card. If you know how to read it, you’ll catch problems before they reach the field.
And if you need to really up your game, check out our full line of SAS testing equipment here