
Your tester logged 4,000 load readings on a job last month. Every one of them passed. Then the customer rejected the third shipment for springs running low on load at the working height.
Nothing was hidden. The warning was sitting right there in the data, a slow slide toward the low limit that started two weeks earlier. Nobody saw it because the only thing anyone looked at was the green PASS on the screen.
This is the seventh article in our spring testing series. We’ve covered how to read a single force-deflection curve and why your results might not match your customer’s. This one zooms out from individual springs to the whole run: what to record, how to chart it, and how to read the patterns that tell you something on the coiler is about to go wrong.
Pass/Fail Is the Least Useful Thing Your Tester Tells You
A pass/fail result answers one question: is this spring inside the drawing tolerance right now? It says nothing about where inside the tolerance it sits, or which way the process is heading.
Take a compression spring specified at 25.0 lbf ±1.5 lbf at a working height of 1.250 in. Two lots both pass 100%:
- Lot A averages 25.1 lbf with readings between 24.6 and 25.6
- Lot B averages 23.9 lbf with readings between 23.6 and 24.3
On a pass/fail report they look identical. In reality, Lot A is centered with room to spare, while Lot B is sitting 0.4 lbf above the low limit. One wire lot change, one worn coiling point, one hotter afternoon in the stress relief oven, and Lot B starts producing scrap.
The tolerance is the customer’s requirement. The spread and center of your readings are your process. Good quality decisions come from comparing the two, and that comparison only exists if you keep the actual numbers.
What to Actually Record
Most testers will store the measured values. The part shops skip is the context, and context is what turns a bad number into a root cause.
The measurements
Record the actual value, not just the verdict, for every characteristic on the print. For a typical compression spring that means load at one or two test heights, free length, and spring rate if it’s specified. If you test extension springs, add initial tension. Torsion springs get torque at the specified angle.
The context
| Field | Why it matters |
|---|---|
| Date and time | Lets you plot readings in production order and spot drift |
| Machine / coiler ID | Separates two machines feeding the same part number |
| Wire heat or lot number | Ties a shift in results to a material change |
| Setup or job number | Shows whether a change lines up with a new setup |
| Operator | Separates handling and technique effects from the process |
| Tester ID | Rules the measurement system in or out |
You don’t need all of this on day one. Time stamp, machine, and wire lot will explain most of what you’ll see. Add the rest as questions come up.
This is also your traceability record. When an automotive or medical customer asks which wire heat went into a lot that failed in the field, you’ll be able to answer in minutes instead of digging through paper travelers.
Control Charts for Spring Makers
A control chart plots your readings in production order against limits calculated from your own process, not from the print. That one difference is what makes it an early warning system instead of a scrap counter.
Setting it up
The workhorse for springs is the X-bar and R chart. Pull a small subgroup, typically five consecutive springs, at a fixed interval off the coiler: every 30 minutes, every 500 pieces, whatever fits your run rate. Plot the average of each subgroup on the X-bar chart and the range (highest minus lowest) on the R chart.
After 20 to 25 subgroups from a stable run, calculate the limits. For subgroups of five, the control limits on the X-bar chart are the grand average plus or minus 0.577 times the average range. A process with a standard deviation of 0.25 lbf on individual springs ends up with limits about 0.34 lbf either side of center.
Control limits are not tolerance limits
This trips people up constantly. Tolerance limits are what the customer will accept. Control limits are what your process normally does. In a capable process the control limits sit well inside the tolerance, which is exactly why they’re useful: they react long before a spring goes out of spec.
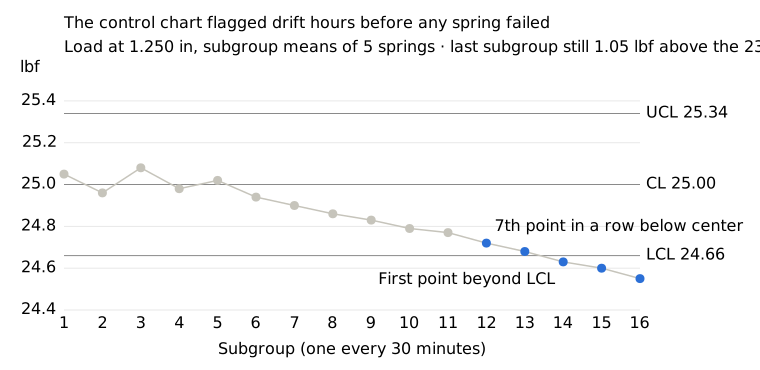
In the example above, every spring in every subgroup passed. But the seventh consecutive point below the center line, and then a point beyond the lower control limit, said the process had changed. That’s your cue to check the coiling tooling, the wire, or the setup while you still have more than a pound of margin.
The rules worth knowing
You don’t need the full rulebook to get value. These three catch most real problems on a spring line:
- One point outside a control limit
- Seven points in a row on the same side of the center line
- Six points in a row steadily rising or falling
The R chart deserves a glance too. If the range suddenly widens while the average holds steady, something is making springs less consistent, not just shifting them.
Cp and Cpk in Plain English
A control chart tells you whether your process is stable. Capability indexes tell you whether a stable process is good enough for the print. You need both, and the second number only means something once the first is true.
The two numbers
Cp compares the width of the tolerance to the natural spread of your process, which is six standard deviations. It ignores where the process is centered.
Cp = (upper limit – lower limit) / (6 x standard deviation)
Cpk does the same comparison, but only against the nearer limit. It’s the one that tells you how close you are to making scrap.
Cpk = (distance from average to nearer limit) / (3 x standard deviation)
Back to Lot A and Lot B
Using the 25.0 lbf ±1.5 lbf spring from earlier:
| Lot | Average | Std. dev. | Cp | Cpk |
|---|---|---|---|---|
| A | 25.1 lbf | 0.20 lbf | 2.50 | 2.33 |
| B | 23.9 lbf | 0.14 lbf | 3.57 | 0.95 |
Lot B is actually the more consistent process, with a higher Cp. But it’s parked against the low limit, so its Cpk falls below 1.0. Both lots passed 100% inspection. Only one of them would survive a capability review.
That also tells you what to fix. Lot B doesn’t need a better machine. It needs to be re-centered, which on a coiler usually means a pitch or coiling point adjustment, not a capital purchase.
What the targets mean
For an ongoing process, 1.33 is the usual floor. On a centered, normally distributed process that works out to roughly 63 parts per million outside the limits, according to this capability reference.
Automotive customers set the bar higher at launch. The AIAG PPAP manual treats an initial process study index above 1.67 as meeting the criteria, 1.33 to 1.67 as possibly acceptable, and below 1.33 as not meeting it, per the 4th edition text quoted here. If you’re quoting work for a Tier 1 supplier, expect to be asked for these numbers on spring load before you ship a single production lot.
Reading the Patterns
Once readings are plotted in order, problems on a spring line tend to show up in a handful of recognizable shapes. Each one points you toward a different part of the floor.
| Pattern on the chart | What it usually means | Where to look first |
|---|---|---|
| Slow drift in one direction | Something wearing or warming up | Coiling points, pitch tool, cutoff tooling, oven temperature |
| Sudden step up or down | A discrete change in the process | Wire lot or heat change, new setup, tooling swap, shift change |
| Repeating cycle | A periodic influence | Oven loading pattern, shop temperature over the day, coil payoff |
| Two clusters (bimodal) | Two populations mixed together | Two coilers, two arbors, or two wire lots in one container |
| Range suddenly widens | Process got less consistent | Worn wire guides, feed roll slip, straightener setting |
| One wild point | A single event, often handling | Mis-seated spring on the tester, damaged part, data entry error |
Two of these deserve a closer look.
The wire lot step
A step change that lines up with a new wire heat is one of the most common patterns spring makers see. Wire diameter tolerance and tensile strength both vary from heat to heat, and spring rate goes with the fourth power of wire diameter. A wire change well inside its own tolerance can move load by a noticeable amount. If you’ve been recording heat numbers, this takes thirty seconds to confirm. If you haven’t, it can take days.
The bimodal histogram
If a histogram of a lot shows two humps instead of one, stop averaging. A single Cpk across two populations is meaningless. Split the data by coiler, arbor, or wire lot and you’ll usually find two perfectly reasonable processes running at different centers. Fix the offset and both humps collapse into one.
Closing the Loop
Data only pays off when it changes what happens at the coiler. A few habits make that happen.
Check the gage before you blame the process
Before you chase a drift, make sure it isn’t the tester. A quick gage repeatability and reproducibility study tells you how much of your observed variation comes from the measurement itself. The automotive rule of thumb is that under 10% of tolerance is good and 10% to 30% may be acceptable depending on the application. If your tester eats a third of the tolerance band, your control chart is mostly charting the tester. We covered fixtures, platens, and calibration in detail in our article on why your results don’t match your customer’s.
Give the operator a reaction plan
A control chart nobody acts on is wall decoration. Write down what the operator does when a rule trips: stop and measure five more, check the wire lot, call the setup tech. Keep it to one page and post it at the tester.
Start small
Pick one high-volume part number with a tight load tolerance. Chart one characteristic, usually load at the primary test height, for two weeks. You’ll learn more about that process in those two weeks than in a year of pass/fail reports.
Make the tester do the bookkeeping
Hand-keying readings into a spreadsheet is where most SPC programs die. A tester that stores each result with a time stamp and part information, and exports it cleanly, removes the friction. If you’re evaluating equipment, ask how results are stored and exported before you ask about anything else.
RK Trading is the North American distributor for SAS spring testers. If you want to talk through how to capture and use test data on your line, from manual benchtop testers to fully automated systems, reach out to our team. We’ll start with your parts and your customers’ requirements, not a catalog.